Evidence-based Clinical Decision Support
Setting the stage:
Background context
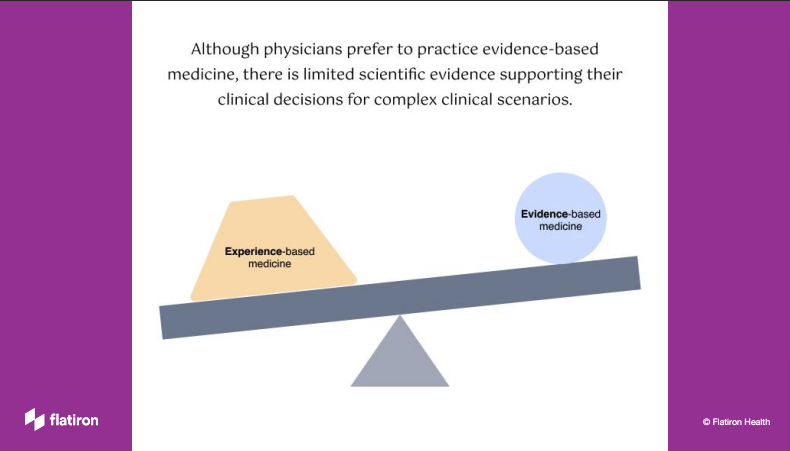
When we choose doctors, we prefer the ones with more knowledge and experience. Experienced-based medicine has been the standard of practice for thousands of years. With increasing access to clinical trials and patient outcome data, more and more physicians start to lean towards evidence-based medicine, in which they use the best available evidence, along with their clinical expertise and the patient's values and preferences, to make decisions.
Company context
Flatiron Health has always functioned as two separate organizations with two distinct groups of target audience. On one side of the organization, we create digital products for cancer clinics and oncologists; on the other side, we produce packaged real-world evidence for academic researchers and pharmaceutical teams to supplement their clinical research needs. This project was a serendipitous opportunity that attempted to bridge the gap between clinical research and patient care, I considered myself extremely lucky to gain precious experience from both sides!
Type of project
This is an exploratory project sponsored by the senior executives in the company. Our head of clinical science and the VP of of product both wanted to better understand if we can leverage our real-world evidence (RWE) to create a unique value proposition for our doctor-facing products.
My responsibilities
I led both the research and design effort of this project as a Design Director. From the methods of research investigation to the workshop with oncologists to the validation of design prototype, I was responsible for the quality of learning and the creative process of the project.
During this two phased process, I got to partner with many passionate colleagues:
Phase I: Physician workshop to assess the opportunity
Partners: VP of clinical care, pharmacy director, product manager, product designer on my team.
Phase II: Prototype to validate hypotheses
Partners: couple quantitative scientists, clinicians, a senior back-end engineer and agency consultants on data modeling.
Phase I - Physician Workshop Design:
“We try to get away from experience-based medicine and towards evidence-based medicine, but when your evidence-base is really shallow, just sometimes, someone who says ‘Oh yeah, I saw something like that and I gave them carboplatin and radiation and it worked.’ and that can be helpful.”
participants
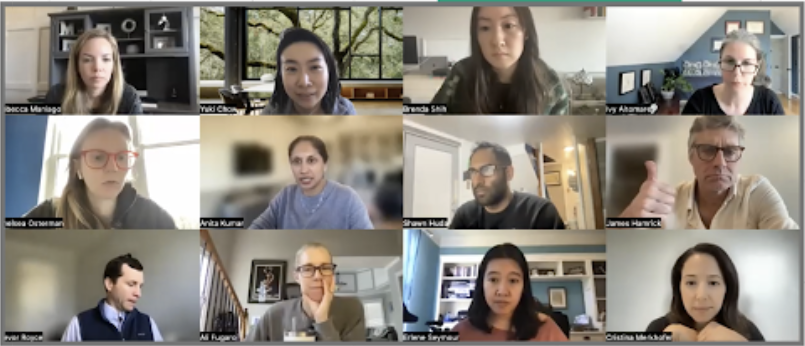
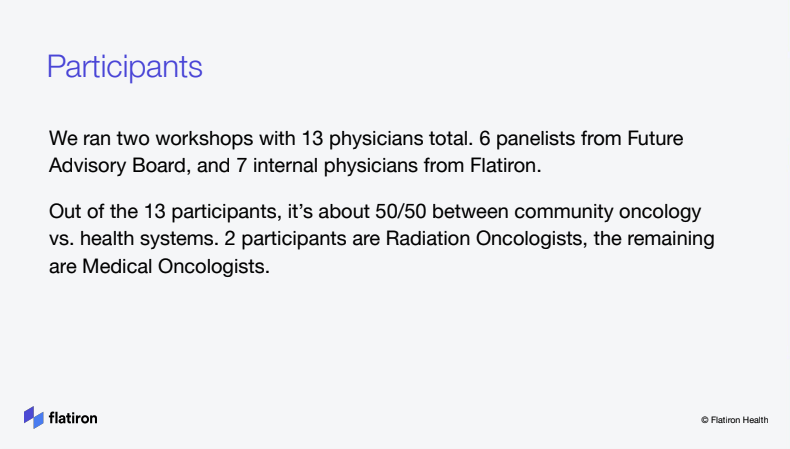
We had the FAB workshop with 6 panelists to discuss complex clinical scenarios and the feasibility of real-world evidence for clinical decision support. Prior to the actual FAB meeting, we also did a workshop dry run with 7 physicians from our internal clinical team. Out of the 13 participants, it’s about 50/50 between community experiences vs. health systems. And 2 of them are Radiation Oncologists, the remaining are Medical Oncologists.
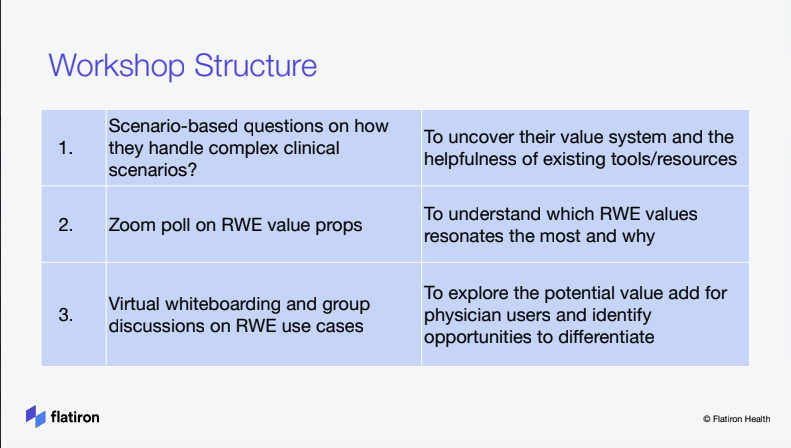
To uncover physicians’ value system
Tell us a clinical case when…
Scenario question 1 [20 mins, 2-3 min per MD] – Tell us about a case when the treatment decision was not straightforward. This would be a “rare” case in your experience.
What made it challenging? How did you approach the decision?
2. To understand which RWE values resonates
Zoom Poll
1. How much would you rely on RWE to increase your confidence on the optimal treatment decision? (1=highly unlikely, 5= extremely likely)
2. How much would RWE cover the gaps of NCCN & Trials for those clinically complex/rare cases? (1=very little, 5=significantly effective)
3. How helpful would RWE be in supporting your conversation with the patient? (1=not helpful at all, 5= extremely helpful)
4. How helpful would RWE be in your decision making process for late line therapy? (1 =not helpful at all, 5 = extremely helpful)
3. To explore the potential value of rwe
What if a conversation AI
has all the real-world data for patient treatments and patient outcome, similar to Siri/Alexa, where you can ask questions to feel more confident in your decision making. What questions would you ask?
Phase I - Physician Workshop Learning:

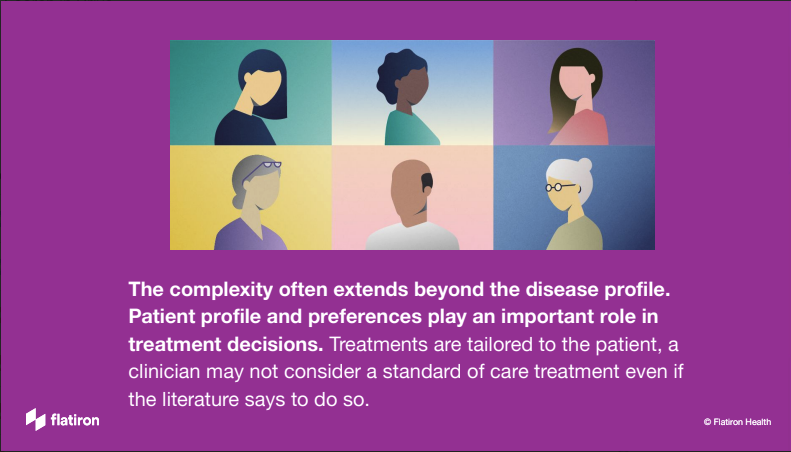
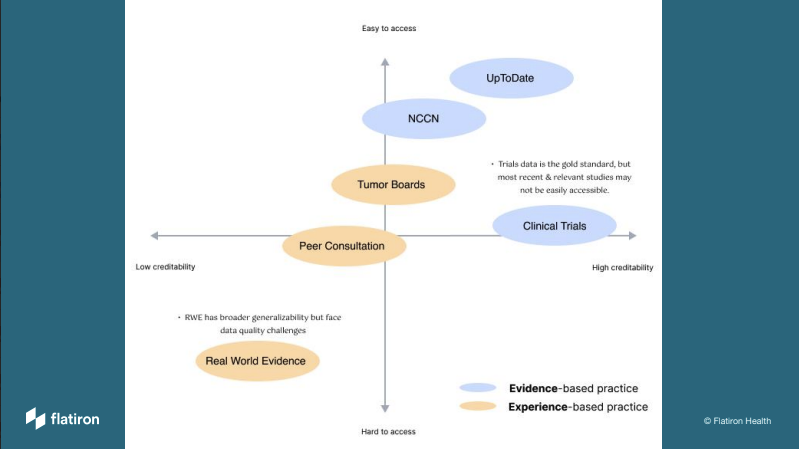
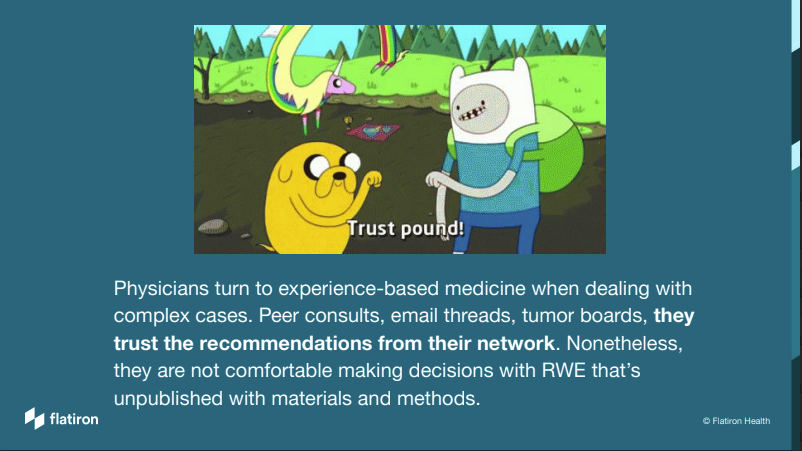
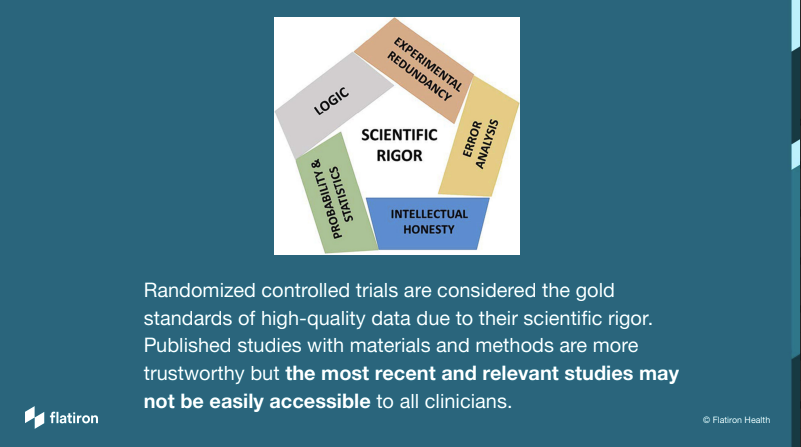
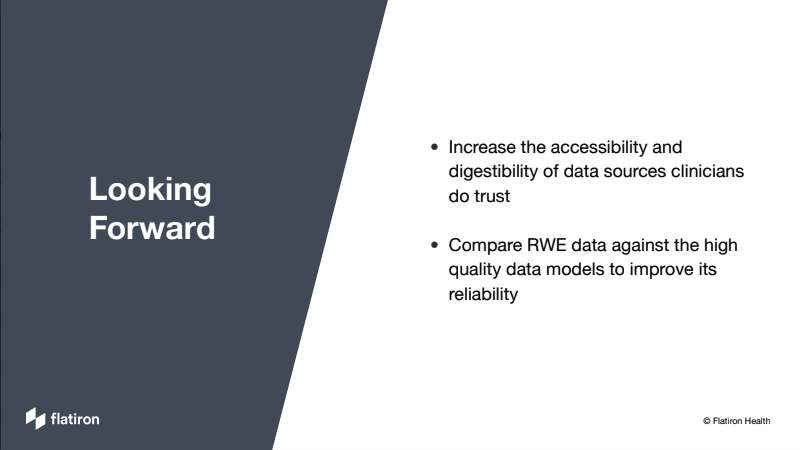
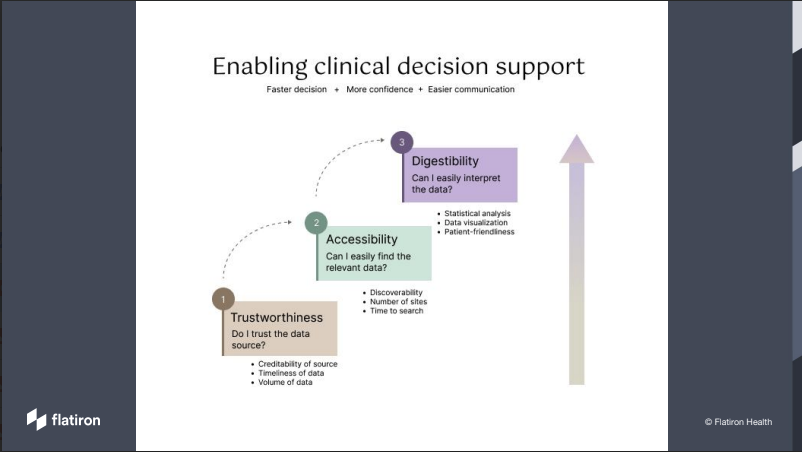
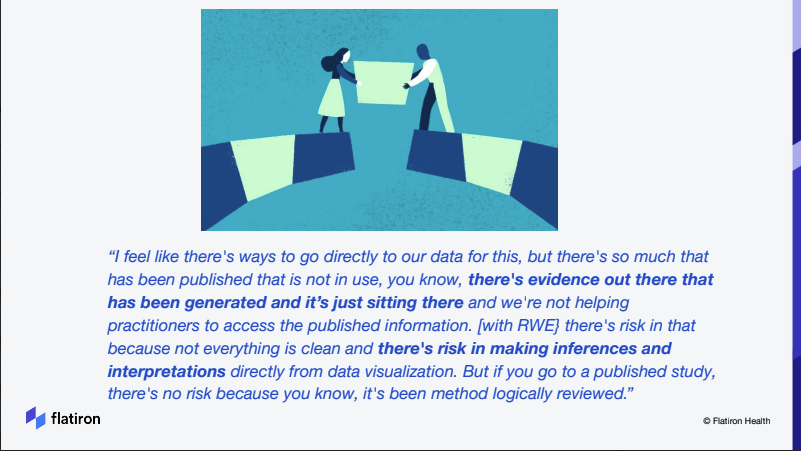
Phase II - Prototype Planning & Design Validation:
Based on the Phase I learning, another team from a different part of the organization decided to run a design experiment to help physicians compare the effectiveness of immunotherapy (IO treatment) alone vs immunotherapy combined with chemotherapy (Chemo-IO treatment) during point of care. I was the connective tissue between Phase I and Phase II, working closely with data scientists to plan and experiment a plug-in for the Clinical Decision Support tool.
Hypotheses
Clinicians want to view S curve , hazard ratio, numbers at risk in a easy to view table format
When there is strong real-world evidence, clinicians want to quickly comprehend on which treatment works best for their patient.
When the input value does not trigger enough real-world data evidence, physicians need to know which treatment would a similar patient get assigned.
For the more data-driven users, they would want to know methodologies used for data collection, processing and cohort analysis, we need to give them transparency to build trust.
Design validation
Learning: validated the need to educate physicians about the tool. Some data savvy doctors want to know more about the models and the source of our real-world evidence, how much does it represent the general patient population at large.
Updated learning: We added the subsection to better explain propensity model and introduce model diagnostics in visual diagrams. While not all physicians were interested in the data science behind the recommendation, some did find it helpful to see the love plot and the probability score.
Learning: This box carried significant weight of the whole flow. The descriptive language could make or break users’ trust of the tool, we needed to use words that resonate. The recommended therapy was prominent enough but the small visual that indicated the certainty of our recommendation was not yet clear.
Updated learning: This iteration showed the confidence level in a more user friendly way, the concept of “patient like this typically gets…” resonated with those physicians.
Overall, the demonstration design project was well received. Physician users did find it valuable given both therapy options are NCCN approved, if the patient can benefit from IO alone without chemo, it would lessen the side effects and increase their quality of life.
Couple highlighted learning below -
The workflow from collecting the patient’s disease characteristics as input to producing the treatment recommendation as the output was perceived to be usable and easy, but physician users desired a more seamless experience where the patient profile could already be pulled from the EHR to avoid duplicative data entry.
The concept of “patients like this..” + clear statistical confidence are the foundation of trust for evidence-based decision support. Missing either one of those elements would render the tool ineffective. Therefore, in order for us to move forward, we need to have significant real-world patient data to 1) showcase various patient cohorts that are similar to the profiles in the clinic setting 2) establish high confidence level of patient outcome between IO and IO + chemo to showcase a solid recommendation in most scenarios [unfortunately, the modeling team wasn’t able to detect a significant difference from analyzing our NSCLC patient cohorts, the team and the CEO ultimately decided not to productize this effort]
Lastly, the digestibility of the analysis plays an important role in clinical decision support. Visual illustration of complex data is not only required but it should also have layers of depths to match users’ intent to fully comprehend the reasoning. Doctors are the curious bunch, they often have a need to explain the treatment decision to their patients, and the want to explore further to become more knowledgable of the latest evidence. They imagined the ideal decision support tool as the continuous education center to support their learning.


